Intermediate Sums in Bridges
You can display intermediate sums (grey bars) in a bridge by adding them to the chart.
For example, to show the years 2020, 2021, 2022, and 2023 in this chart,…
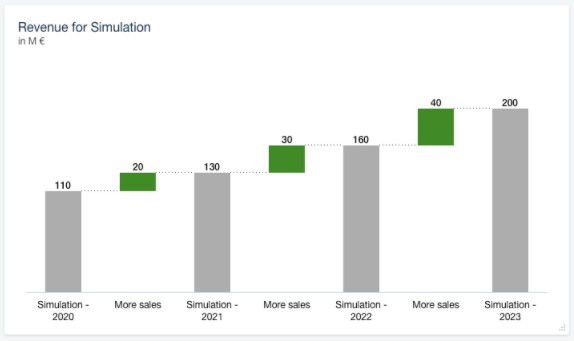
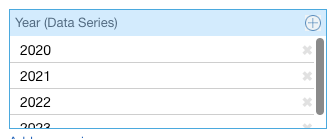
… you have to add them as years in the sidebar.
You can display intermediate sums (grey bars) in a bridge by adding them to the chart.
For example, to show the years 2020, 2021, 2022, and 2023 in this chart,…
… you have to add them as years in the sidebar.